Life on land
79% (174 of 220 species) of our land species are either threatened with or at risk of extinction
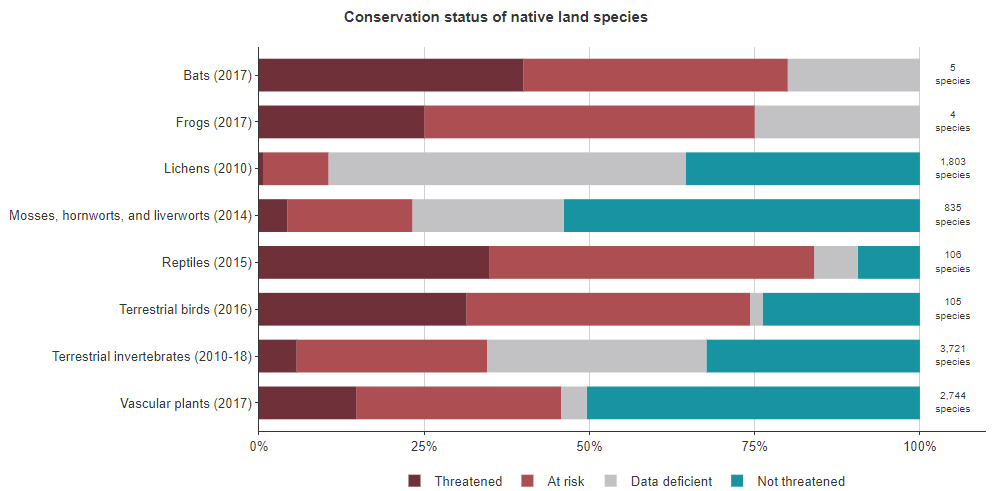
Conservation status of native land species
Of the species assessed, 79 percent (174 of 220 species) of indigenous terrestrial vertebrate species (bats, terrestrial birds, frogs, and reptiles) were classified as either threatened with or at risk of extinction.
The following were classified as threatened with or at risk of extinction:
- 80 percent of bats (4 species), and 74 percent of terrestrial birds (78 species), 75 percent of frogs (3 species), and 84 percent of reptiles (89 species)
- 46 percent of vascular plants (1,253 species), 23 percent of mosses, hornworts, and liverworts (194 species), and 10 percent of lichens (189 species)
- 35 percent of terrestrial invertebrates (1,285 species).
Of the 9,323 assessed species, 27 percent (2,519) were classified as data deficient, which means we don’t know enough about them to evaluate their conservation status.
The two groups that have the largest proportion of species classified as data deficient were:
- lichens (54 percent or 975 species)
- terrestrial invertebrates (33 percent or 1,235 species).
Some species’ conservation status has changed between assessment periods (the years are given in brackets).
- The following improved:
- 12 bird species (2012–16), three-quarters of these (75 percent or 9 species) may move to a worse conservation status if current conservation management ceases
- two vascular plant species, small fathen and hairy willowherb (2012–17)
- one bat species, southern short-tailed bat (2012–17).
- The following worsened:
- 61 vascular plants (2012–17)
- five terrestrial birds (2012–16): Australasian bittern/matuku; orange-fronted parakeet/kākāriki; whitehead/pōpokotea; and South Island and North Island robin/toutouwai
- three reptiles (2012–15), all of which are geckos
- ten terrestrial invertebrates, this includes six moth species (2010–2015), two ground beetles and one weevil (2005–2010), and one ground weta (2010–2014).
Soil and levels of cadmium in New Zealand

Cadmium Accumulation in Waikato Soils
Conservatively, the average cadmium concentration in Waikato dairy soils is projected to reach the recommended guideline in under 16 years.
Dr Nick Kim\’s report, mentioned above, looks specifically at the issue of Cadmium in Waikato soils. The current status of Waikato’s productive soils is succinctly stated in the executive summary:Based on recent sampling, it is estimated that perhaps 11% of Waikato’s pastoral soils and 17% of Waikato’s horticultural soils already exceed 1 mg/kg soil cadmium. For horticultural soils, this would represent approximately 1775 hectares of land. For pastoral soils (sheep, beef and dairy land), this would represent about 157000 hectares. Within the pastoral soils sample set, all soil samples that have so far exceeded the 1 mg/kg agricultural guideline have been from dairy farms.On average, Waikato’s productive pastoral, horticultural and arable surface soils now contain five times more cadmium than they began with, and are two-thirds of the way to the 1 mg/kg threshold.Loading calculations confirm that the dominant source of this cadmium is superphosphate fertiliser, which contains cadmium as an impurity. Projections for pastoral and horticultural soilsAt current cadmium loading rates, the next significant point at which the 1 mg/kg cadmium guideline will be reached over wide land areas is expected for dairy farms, which cover about 25% of the Waikato region (about 623000 hectares).
Quick facts about Cadmium
- Heavy metal with a high toxicity.
- Toxic at very low exposure levels and has acute and chronic effects on health and the environment.
- not degradable in nature and will thus, once released to the environment, stay in circulation. New releases add to the already existing deposits of cadmium in the environment.
- Cadmium and cadmium compounds are, compared to other heavy metals, relatively water soluble. They are therefore also more mobile in e.g. soil, generally more bioavailable and tend to bioaccumulate.
Effect on ecosystem
- Cadmium is readily accumulated by many organisms, particularly by microorganisms and molluscs where the bioconcentration factors are in the order of thousands.
- Soil invertebrates also concentrate cadmium markedly.
- In animals, cadmium concentrates in the internal organs rather than in muscle or fat. It is typically higher in kidney than in liver, and higher in liver than in muscle. Cadmium levels usually increase with age. (In New Zealand as at 2002 the offal of animals older than 2.5 years was not permitted to be sold for human consumption for this reason. Dr Nick Kim Cadmium Accumulation in Waikato Soils – Environment Waikato 2005)
A major part of cadmium in the human diet comes from agricultural products.
- The most important sources of cadmium to agricultural soils are atmospheric deposition and direct inputs through, for example, the application of phosphate fertilizers and other soil amendment products.
- Some of the regulative focal points in many countries have been decreasing the cadmium content of fertilisers and restriction on the input of cadmium to farmland by the application of sewage sludge and other waste products.
Health Effects
- Cadmium accumulates in the human body and especially in the kidneys. According to the current knowledge kidney damage (renal tubular damage) is probably the critical health effect, both in the general population and in occupational exposed workers /Järup et al 1998/.
Life in the marine environment
The following are either threatened with or at risk of extinction:
- 90% of seabirds (86 of 96 species),
- 80% of shorebirds (12 of 15 species),
- 26% of indigenous marine mammals (8 of 31 species),
- 81 % of marine invertebrates (333 of 412 species)
- 9 % of sharks, rays and chimaeras (10 of 107 species).
Many of New Zealand’s marine species are found nowhere else in the world. This data is from DOC.

Conservation status of native marine species
Many of New Zealand’s marine species are found nowhere else in the world. Data from DOC shows the percentage of species either threatened with or at risk of extinction:
- 90% of seabirds (86 of 96 species),
- 80% of shorebirds (12 of 15 species),
- 26% of indigenous marine mammals (8 of 31 species),
- 81 % of marine invertebrates (333 of 412 species)
- 9 % of sharks, rays and chimaeras (10 of 107 species).
There is not enough information to assess the conservation status (classified as data deficient) of
- 39 % of sharks, rays, and chimaeras (42 species), and
- 39 % of marine mammals (12 species).
Also classified as data deficient were 60 species of marine invertebrates (15 % of the identified species), but most of the existing species have not yet been described.
Maui Dolphin
From the Department of Conservation
- New Zealand’s rarest dolphin, the Maui’s dolphin, is on the edge of extinction. With fewer than 100 left in the wild, this small, round-finned dolphin needs all our help to survive.
- A ban on set netting and trawling along part of the North Island’s west coast, together with more stringent controls over petroleum and mineral prospecting and mining, are big steps forward to help protect Maui’s dolphin.
- Maui’s dolphins are classified as Nationally Critical, the highest ‘at risk’ classification in the New Zealand Threat Classification System. The dolphins are also listed as Critically Endangered by the International Union for Conservation of Nature (IUCN). This means there is a high risk of the subspecies becoming extinct in the near future.
- Maui’s dolphins are known to live up to 20 years. Females are not sexually mature until 7-9 years old and produce just one calf every 2-4 years. This means any population increase is slow.
- Recent studies suggest the number of Maui’s dolphins has reduced since earlier surveys and may still be declining. Their range has also reduced, with most sightings of dolphins now between the Manukau Harbour and Port Waikato.
- Interestingly, DOC surveys in 2010 and 2011 found that there were at least two South Island Hector’s dolphins swimming among the Maui’s dolphins. While there is no evidence yet of interbreeding, if they did interbreed this may provide Maui’s dolphins with a much-needed boost by increasing genetic diversity.
Human-induced threats
Unfortunately the close inshore distribution of Maui’s dolphins overlaps with many coastal activities that pose a threat to their survival. Maui’s dolphins can be affected by human activities in the following ways:
- Becoming entangled in fishing gear and drowning, including from set netting, trawling and drift netting
- Being hit by boats and their propellers
- Becoming entangled in or ingesting marine litter (especially plastics)
- Pollution
- The effects of marine mining and construction, including seismic surveys.
Non human-induced threats
Some other threats are beyond our control but could have significant effects due to the small population size of Maui’s dolphins. These include:
- Disease
- Predation from sharks and orcas (killer whales)
- Extreme weather, which can cause mothers and calves to be separated, resulting in the death of the calf.
Set netting bans Set netting poses a threat to Maui’s dolphins. Fisheries regulations now ban set netting along part of the west coast of the North Island.
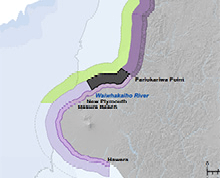
2014: New measures
After a lengthy public consultation on the protection of Maui’s dolphins, in 2013/2014 the government decided to –
- Retain the set-net ban around Taranaki
- Extend the protection slightly south of Pariokariwa point
- Increase observer coverage on fishing vessels to see if any dolphins are caught as by-catch to prioritise research.
This is a step in the right direction but it falls well short of stopping Maui’s dolphins from becoming extinct.
What Forest & Bird wants Within the next 3 years:
- immediate protection of the full range of Maui’s dolphin habitat
- from Maunganui Bluff to the Whanganui river, including all five harbours along the west coast of the North Island, and extending offshore to 20nm and
- removing all threats within this area including set nets, trawling, marine mining and seismic surveying
In addition to this, we want the Government to help fishers transition to more sustainable fishing methods that can be used within this protected area
- We strongly support the International Whaling Commission Scientific Committee’s June 2014 recommendation that the Government take urgent action.
- It recommends that they cease seeking further scientific research on Maui’s dolphins and instead concentrate their efforts on to eliminate by-catch of Maui’s dolphins.
Long-term goals We want to see a priority on Maui’s and Hectors dolphin research and population targets developed and progress monitored to help ensure the recovery of the rarest dolphins in the world.
The additional area of protection provided around Pariokariwa.
For further information contact Forest and Bird

Biodiversity
Predator Free 2050
Brief timeline
- 2016 (July) Government announces the goal that all rats, stoats and possums will be eradicated in by 2050
- Rats, possums and stoats kill 25 million of our native birds every year, and prey on other native species such as lizards
- these pests also threaten our economy and the primary sector, with their total economic cost estimated at around $3.3 billion a year.
Additional information on the fight against Kauri diebackDraft Kauri Dieback Pest Management Plan
Collaborating and cooperating to achieve 2050 goals
- Connecting with communities, iwi, private businesses, philanthropists, scientists, and government.
- Government funding of $28 million over four years and $7 million per year thereafter. This is on top of over $70 million already spent each year on predator control by Government, Regional Councils, OSPRI, businesses, iwi, communities, and others.
- A focus on developing breakthrough predator-control tools and techniques, and the forging of necessary networks – we do not yet have the technology to achieve a predator-free New Zealand.
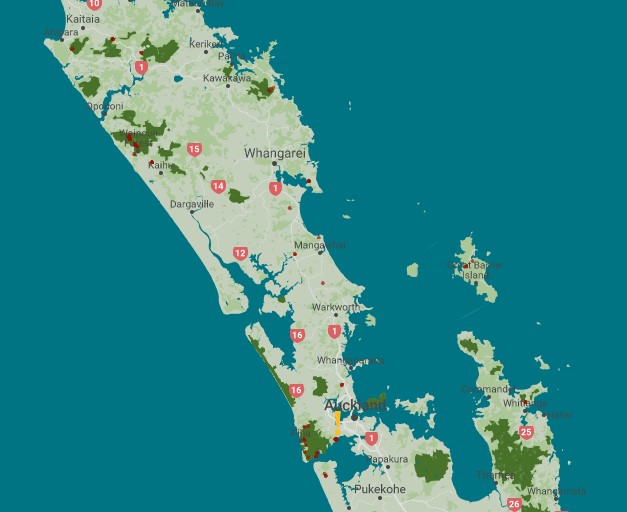
Current projects
Landscape projects
- Taranaki,
- Hawke’s Bay,
- Wellington,
- Waiheke Island,
- Dunedin,
And 12 research contracts. The landscape projects have an overall funding ratio of $2.80 to $1.00, while science projects are $2.30 to $1.00.
Kauri Die back
Brief timeline
- 1970 Kauri dieback was first noticed on Great Barrier Island. It was thought to be a fungus with little risk to kauri.
- 2008 (April) Kauri dieback was properly named by Manaaki Whenua – Landcare Research work in April.
- 2008 establish that Kauri dieback was a ‘new species to science’ and a threat to kauri ecosystems.
- 2009 Kauri dieback programme established allocated $2 million per annum
- 2010 Hygiene protocols developed
- 2011 Keep Kauri Standing branding created
- 2011 Waitakere and Hunua Aerial Surveillance Begins
- 2012 Trial of cleaning stations
- 2013 Feral pigs confirmed as a vector for the disease
- 2014 Kauri Dieback discovered on the Coromandel Peninsula
- 2015 Remote sensing programme begins
- 2016 DOC programme to upgrade tracks
- 2016 GIS mapping and Feild APP project begins
- 2017 Disease status guidelines developed
- 2017 Research into developing a diagnostic/predictive tool
- 2018 3 new measures to strengthen the fight against Kauri dieback
- Controlled Area Notice (CAN)
- a Strategic Science Advisory Group
- a National Pest Management Plan developed
- 2019 March 3rd round of consultation on National Pest Management Plan concluded.
Additional information on the fight against Kauri diebackDraft Kauri Dieback Pest Management Plan
Distribution of selected native species 2014 - the data collected by StatsNZ is no longer is the same format

The distribution of all seven indicator species has continued to decline since the 1970s
- The distribution of kōkako and mōhua (yellowhead) has declined markedly since the 1970s.
- Four species – the short-tailed bat; dactylanthus (a flowering plant); and two bird species, the mōhua (yellowhead) and kōkako – are now found in only 5 percent or less of their pre-human range.
- Changes to the distribution of these seven species, in the total hectares each species can be found in, can indicate changes to ecosystems or the presence of pest species.
(This graph remains unchanged since it was included in 2014)
Most of the data on this page is from StatsNZ – StatsNZ provides environmental information on the five environment domains:
- air
- atmosphere
- climate
- freshwater
- land
- marine
- and the cross-domain area of biodiversity.
just so you know we are on the lookout for positive stats!!