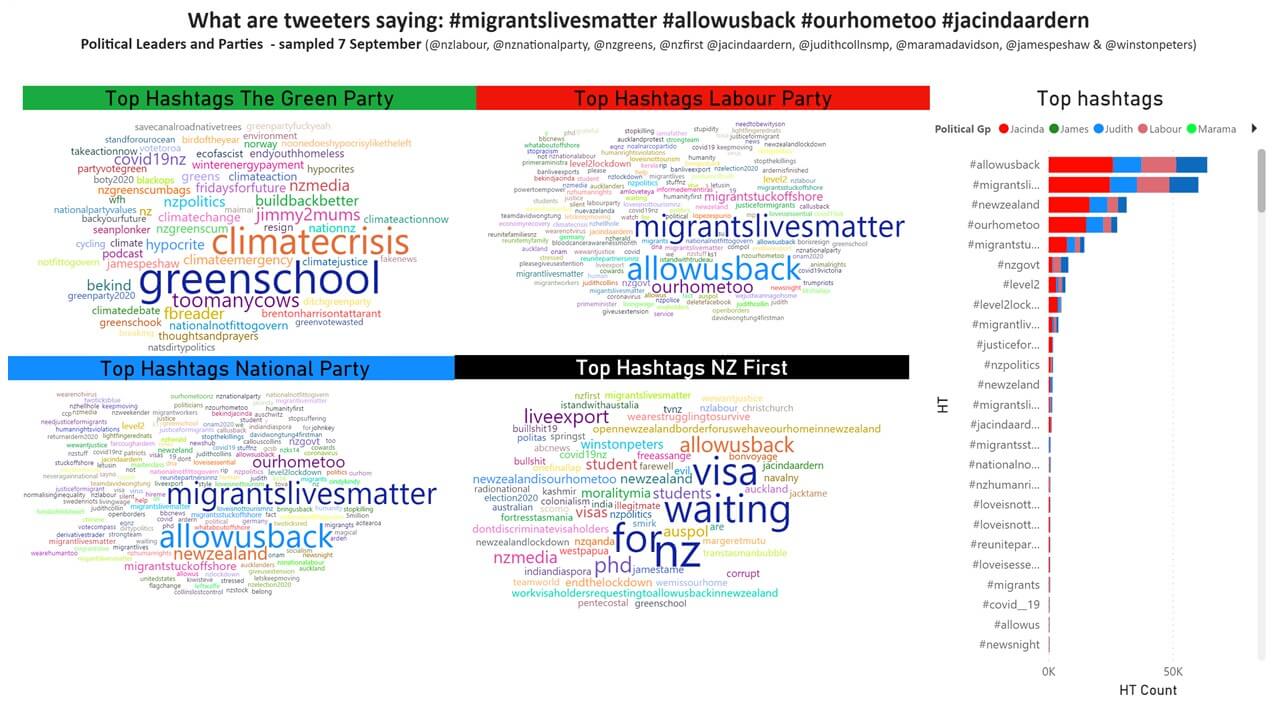
Twitter activity 29 August – 7 September for political parties and their leaders. This provides an in-depth data visualization dashboard to better grasp the facts and figures.
Previous PostIs climate change New Zealand's nuclear free moment?
Next PostHow NZ is doing in reducing greenhouse gas emissions?