
Disposable Income

Unless otherwise stated information comes from Stats NZ 2019

Definition

the amount of money that households have available for spending and saving after income taxes have been accounted for

For the year ended June 2019:
  • average annual household income (gross) was $102,613
  • average annual household disposable income (after tax and *transfer payments) was $81,934
  • average annual household equivalised disposable income (after tax and transfer payments) was $45,744
    • (*transfer payments are Government payments like unemployment benefit, superannuation etc)
    • (equivalised disposable income is the income available to households after paying for housing)

The Problem

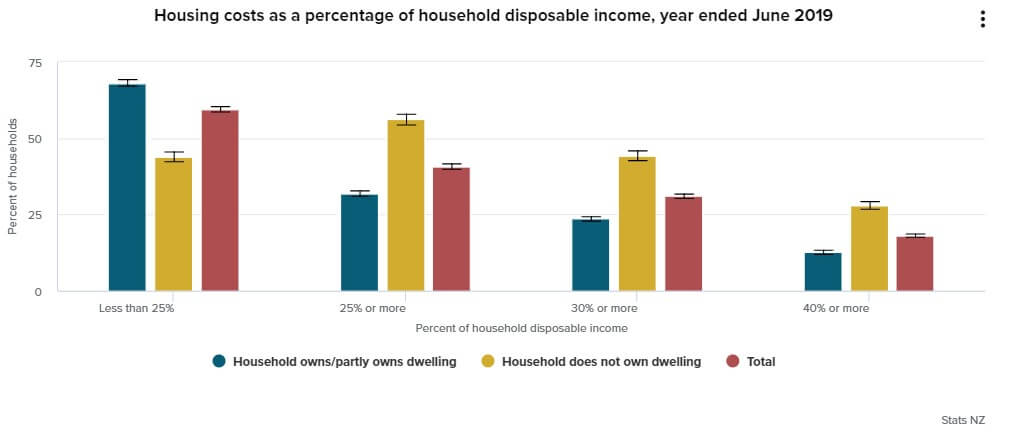
The burden of high housing costs has fallen disproportionately on those with lower incomes

Key facts

2019 NZers were asked about their capacity to spend money on accommodation, food, clothing, and other necessities

  • 63% of respondents reported their income was enough or more than enough to meet their everyday needs.
  • 36% said their income was just enough or not enough to meet their everyday needs.

(2019 StatsNZ)

Key facts

  • average weekly property and ground rent payments increased from $110.80 to $122.50 (up 10.5 %)
  • average weekly mortgage interest payments decreased from $88.50 to $80.00 (down 9.6 %)
  • average weekly property rate payments decreased from $40.10 to $37.90 (down 5.5 %)
  • households spent about one-fifth of their disposable income on housing costs on average (i.e $21 of $100)
  • 31 % of households spent 30% or more of their income on housing costs.

Effects of high housing costs

  • Housing costs continue to reduce the amount of disposable income available for everyday expenses such as food, education, health, transport etc.
    • Housing and associated costs (insurance, maintenance, rates) is the main expense for the majority of New Zealanders.
    • The increasing cost of housing is not matched by an increase in income.

In 2019 rents increased by 2.5% (consumers price index for the June 2019 quarter)

Solutions

Regional housing costs 2019

  • Auckland ($22,657)
  • Wellington ($17,556)
  • Rest of North Island ($13,939)
  • Canterbury ($16,036)
  • Rest of South Island ($12,459).

Regions showing significant changes over the year were:

  • Auckland (property rates down 9.4% from 2018)
  • Rest of North Island (property and ground rent, up 7.9% from 2018).

Stats NZ - since 2012 disposable income had trended upwards

Stats NZ – 2017 Except for 2009, average disposable income has increased every year since 1992

  • New Zealand’s real gross national disposable income (RGNDI) per person increased 66 percent between 1992 and 2016.
  • The rise was constant from 1992 until a decrease in 2009. Since then RGNDI has continued to rise.
  • This measure of disposable income is a broad welfare indicator for New Zealand.

OECD Data - shows a declining trend since 2011

OECD – Household disposable income

 Definition

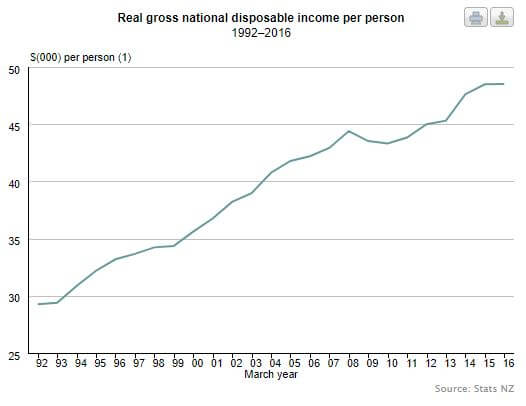
Real household net disposable income is defined as the sum of household final consumption expenditure and savings, minus the change in net equity of households in pension funds.

OECD – Household savings

Net household saving is defined as:

  • the subtraction of household consumption expenditure from household disposable income,
  • plus the change in net equity of households in pension funds.

Household saving is the main domestic source of funds to finance capital investment, a major impetus for long-term economic growth.

This indicator is measured as a percentage of household disposable income. Data are under 2008 System of National Accounts (SNA 2008) for all countries except for Chile, Japan and Turkey (SNA 1993).