

Public services run on resources that are, by definition, never quite enough — and that is as true of healthcare as it is of the energy, education or the welfare system. The question is rarely whether to spend, but where to spend. And that question is only as good as the picture of strain it is based on.
Social Herds reads New Zealand’s media coverage as one such picture across several sectors: not a verdict on any system itself, but a record of where it is described as creaking, and how loudly.
Health is where we are looking most closely, because it is a sector New Zealand has more power to shape. Energy strain is affected by forces well beyond the country’s control, from global oil & gas prices to supply constraints and shortage risks. Health also faces wider pressures, but many of its fault lines are domestic: how many beds are funded, how staff are retained, which services receive investment, and where pressure is allowed to accumulate.
Over the past six months, health is a sector where strain has moved the most.
In one nine-day stretch this June, nine New Zealand health headlines reported the same underlying problem from nine different angles: a staffing model buckling here, a funding gap widening there, an ageing IT system failing somewhere else. None of the nine mentioned the other eight. Read alone, each looked like an isolated story. Read together, they describe a health system under strain on several fronts at once — a pattern invisible to anyone following the news one headline at a time.
The analysis distinguishes between headlines about isolated events and those that point to wider system pressure. In this nine-day period, health recorded its highest concentration of system-pressure flags since tracking began six months ago. The wider dataset covers 9,908 headlines from New Zealand’s main news media, including 552 about health.
The week had begun with announcements:
- faster access to maternal mental-health support,
- $100m in fresh mental-health funding,
- a proposal to let pharmacies dispense some medicines without a GP’s say-so.
It ended with Health NZ confirming:
- cuts to clinical roles across the top half of the North Island,
- after-hours clinics closing in several regions,
- and a single headline that captured the whole argument in miniature — new mothers had been promised a three-day maternity stay. Still, no one had funded the beds to provide them.
That gap, between what is promised and what the system can apparently deliver, runs through six months of coverage like a fault line.
Let’s be clear, this is not an evaluation of the health system itself. It is an analysis of how the system is being described — and of how often health coverage now reaches for words that signal alarm, pressure, and strain. The pattern is real; the cause is not proven.
Crisis, or closer attention?
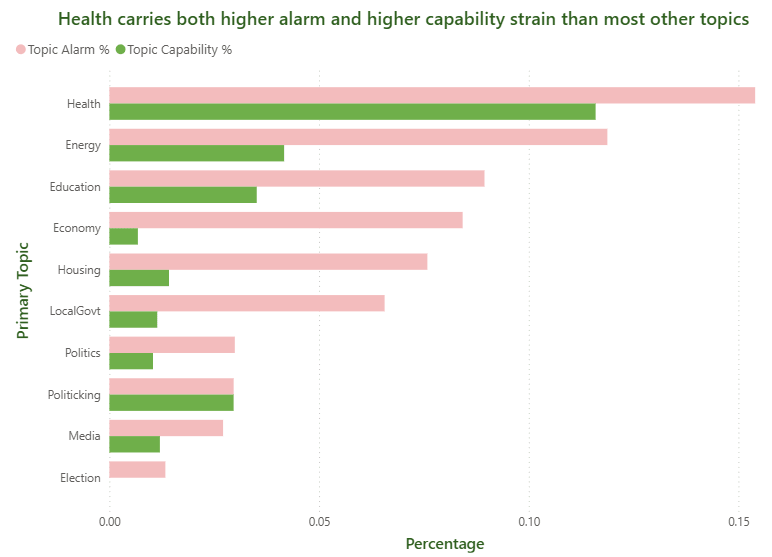
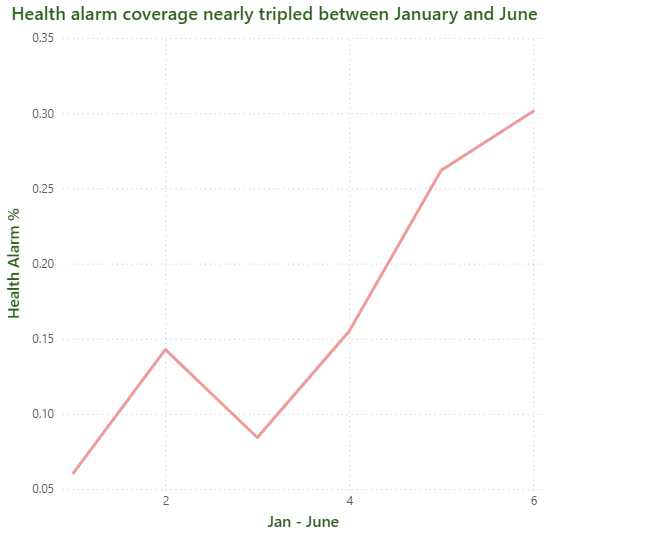
Alarm language in health headlines is increasing in frequency. Across the full dataset, 7.6% of headlines use alarm language — crisis, surge, warning, threat. For health, the rate is 15.4%, roughly double the average and nearly double the economy’s equivalent figure, 8.4%. In January, 6.1% of health headlines carried such language. By May, the figure had risen to 26%. By June, it was just under a third.
Impact of the budget on framing health funding
The alarm was already climbing before the Budget landed — and the Budget didn’t change that. The health sector’s own verdict on it was blunt: an ambulance services boss told Newsroom the Budget risked delivering only a “short-term Band-aid” to a broken funding model, while The Conversation called the health investment a sign of “continued austerity without long-term vision.” By the time it landed, headlines were calling it “insufficient and poorly targeted,” with aged care among the areas it failed to stabilise.
System Straining
In addition to the ‘alarm’ category, our capability flags (those with a systemic focus) provide further insights. Of 552 health headlines, 64 (11.6%) report on systemic strain. These headlines are clustered around five main pressures:
- Workforce Departures: This includes comments from medical professionals, such as a GP advising medical students to consider other career options.
- Funding Shortfalls: For example, some hospices have had to turn away dying patients due to financial constraints.
- Physical Assets: There have been repeated incidents of hospital IT outages and reports of ageing infrastructure.
- Access Issues: This includes hidden waiting lists and orthopaedic patients facing weeks-long delays for ACC approvals.
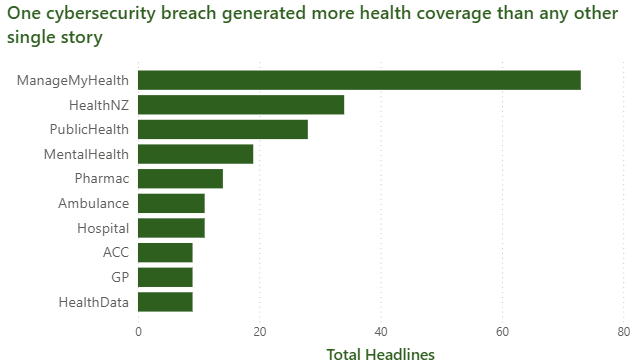
- Technology Failures: Notably, the ManageMyHealth data breach generated 73 headlines, accounting for 13.2% of all health coverage. This single cybersecurity incident became the most-covered health story in the past six months.
A data breach is noticeable, abrupt, and easy to headline. In contrast, a workforce shortage is gradual, widespread, and difficult to summarize.
Each of the five pressures can be reported faithfully on its own. None of them, when read alone, looks like what it is: a system under strain on five fronts simultaneously. That picture only assembles itself when the headlines are read together, which is precisely what no single reader, on any single day, is doing.
Same system, different lens
Were you to ask a New Zealander how the health system is doing, the answer would depend partly on which media they attend to. A Herald reader may hold the view that the health system is pressured but governable. At the same time, a Newsroom reader will have built up a picture of a system in genuine strain. Neither impression is wrong, exactly. They’re just built from different perspectives.
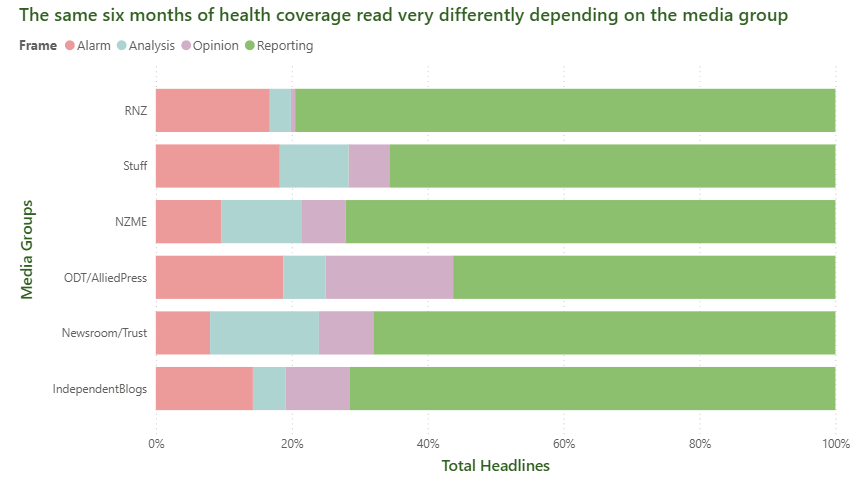
Stuff and RNZ together produce more than half of all health coverage in the dataset, but their coverage is not interchangeable. RNZ’s analysis rate, at 3%, is the lowest among the major outlets measured, suggesting that most of its health output is description rather than explanation. NZME runs lower rates of both alarm and capability framing than its peers, which makes systemic strain correspondingly less visible to its readers — not absent from the system, just absent from the coverage.
ODT and Newsroom, smaller players by volume, carry the highest capability rates in the dataset, 22% and 20% respectively: they do more systemic framing per headline even though they publish far fewer headlines overall.
The health system being described is, of course, the same system in every case. What changes is the lens. A reader loyal to a single media may deduce moderate pressure within Health. A reader who follows several at once sees workforce strain, funding gaps, ageing infrastructure, and a cybersecurity breach all within the same six months.
Promising access in a system short of capacity
A prominent health promise of the election cycle was three free health professional visits (including GP visits), a policy aimed squarely at demand: making it cheaper to see a doctor. The headlines, almost without exception, describe a problem on the supply side, whether there are enough doctors, beds, services and working IT systems to meet demand at all.
Of 552 health headlines, only 21 — 3.8% — describe a policy response, promise or delivery. The remaining 531 are problem-framed. Within that thin solution slice, the split is nearly even: eleven headlines announce something, from a GP-fee freeze to a diabetes-care roadmap; ten confirm something has been delivered, from a funding boost for St John to expanded pharmacy services. Even the good news, in other words, is evenly divided between what is done and what is merely promised.
What the announcements promise and what the wider coverage diagnoses do not always rhyme. “Thousands of registered patients, one GP on site” is a supply story. “The health postcode lottery won’t be fixed by redistributing an already stretched workforce” is a direct rebuttal of solutions that shift existing capacity rather than expanding it. “Why some of NZ’s best doctors won’t work here anymore — and it’s not about pay” quietly undercuts the assumption that fee adjustments alone will fix retention.
Free GP visits may well help patients who can already get an appointment. If capacity is the binding constraint, as the coverage suggests, cheaper access mainly directs more demand at a system that the same coverage says is already short of road.
International comparisons
These deserve caution, given known inconsistencies in New Zealand’s OECD data submissions since 2018. Even so, the available benchmarks sharpen rather than soften the point:
- New Zealand spends roughly 6% of its health budget on primary care, compared with an OECD average of 14%, and
- has 2.5 hospital beds per 1,000 people, compared with an OECD average of 4.2.
Across six months and 552 headlines, only one article referenced this.
A solution is only as good as the problem it solves — and, on the evidence of six months of headlines, the problem being solved for and the problem being reported are not quite the same thing. Workforce, funding, physical assets, access and technology each surface as their own clean, isolated story, reported faithfully by outlets with no obligation to read one another’s coverage.
But the pattern was there the whole time, sitting in plain sight across 552 headlines and 32 newsrooms — waiting for someone to read all nine days at once.
Health Budget Figures 2026
Overall: same Budget, mostly same story
Both articles say:
| Point | Article 1 | Article 2 | Same or different? |
|---|---|---|---|
| Total Vote Health Budget 2026 | $34.2b | $34.2b | Same |
| Increase from previous year | 10% | About 10% | Same |
| New health funding over several years | $5.8b over four years | Discusses funding spread through to 2029–30 | Similar, but framed differently |
| Health gets largest share of new spending | 70% of all new government spending | Says health gets largest share of investment | Same idea, but Article 1 gives the 70% figure |
| Budget mostly maintains current services | Says it largely maintains status quo | Says it will “maintain current health settings” | Same |
| Primary care lacks enough support | Says no dedicated primary care uplift | Says primary care needed investment but did not get enough | Same |
| Workforce shortages are a major concern | Says no specific workforce recruitment/retention initiatives | Says workforce should have been front and centre | Same |
| Infrastructure is a major focus | Says $668m capital expenditure | Mentions hospital investments, including Whangārei and Dunedin | Same theme, different detail |
| Cybersecurity gets funding | $153m | $152m over five years | Slightly different |
Main differences between the two articles
| Area | Article 1 emphasis | Article 2 emphasis |
|---|---|---|
| Tone | Insufficient and poorly targeted | Cutback budget / continued austerity |
| Main benchmark | Compares funding with “keep the lights on” and catch-up estimates | Compares annual growth with inflation |
| Funding adequacy | Says $1.375b/year is about $30m short of the $1.405b/year needed just to maintain services | Says compound annual growth is only 3.49%, basically matching inflation |
| Primary care | Gives more numbers: NZ spends 6% of health budget on primary care vs 14% OECD comparison | Strongly argues primary care needed investment, but gives fewer comparison figures |
| Pharmac | Gives detailed Pharmac figures: $54m over four years, $13.5m/year, less than 1% of $1.76b budget | Does not focus on Pharmac |
| Health system pressure | Gives more system-pressure figures: unenrolled population, GP access, declined referrals, waiting lists, medicines | Discusses pressure more generally: workforce shortages, unmet specialist need, GP pressure |
| Reform costs | Does not focus on reform cost | Says repeated reform costs are likely in the hundreds of millions |
| Medical school | Mentions previously committed new medical school only briefly | Gives $80m and says it will not help until 2035 |
Specific figure differences or possible inconsistencies
There are a few numbers that do not exactly match.
| Item | Article 1 | Article 2 | Comment |
|---|---|---|---|
| Cybersecurity | $153m | $152m over five years | Very close; likely rounding or source difference |
| Bowel screening | $33.1m | $12.4m over five years | This is a real difference and worth checking |
| Ambulance services | $35m | $35m over five years | Same total, but Article 1 does not clearly state the time period in the summary |
| Paediatric palliative care | $15.5m | $15.5m over five years | Same amount; Article 2 clarifies time period |
| New health funding period | $5.8b over four years | Growth through to 2029–30 | Not necessarily contradictory, but they are using different time frames |
| Pharmac uplift | $54m over four years | Not discussed | Difference in coverage, not contradiction |
| Infrastructure | $668m capital expenditure | Mentions hospital projects but not the same total | Difference in detail, not contradiction |
The biggest substantive difference
The two articles reach a very similar conclusion, but by different routes:
| Article | Core argument |
|---|---|
| Article 1 | The Budget is not enough because it falls short of estimated health-system need, especially primary care, Pharmac, workforce, and catch-up funding. |
| Article 2 | The Budget is not enough because the headline 10% increase becomes only 3.49% annual growth, roughly matching inflation, so it signals austerity rather than real expansion. |
Plain-English conclusion
They are talking about the same Budget 2026 health package and largely agree: the Budget looks large at headline level, but both argue it mostly maintains the existing health system rather than fixing deeper problems.
The main differences are that Article 1 is more numbers-heavy on health-system need and primary care, while Article 2 is more focused on austerity, inflation, workforce, and the politics of short-term budgeting. The only figures I would double-check before using publicly are the bowel screening amount and the cybersecurity amount, because they differ slightly or substantially between the two articles.