How well is New Zealand’s working, and what needs to change?

Economic success should mean more than a bigger economy. It should support secure work, rising purchasing power, reliable infrastructure and public services, while maintaining the resources and resilience needed for the future.

For the 2026 election, the questions are: how well is the economy performing, what is holding back progress, and do parties’ proposals address those problems? This page considers the economy as a whole. The Cost of Living page examines the affordability of everyday essentials.

What are we getting from economic policy and public spending?

Each section gives an assessment alongside the evidence on spending, delivery and outcomes.

How the economic pressures connect

Lasting improvements require productive investment, affordable essentials and effective public services to reinforce one another. A rise in GDP or national median income is insufficient evidence that struggling households are better off. Economic policy should be judged by secure employment, income after essential costs, access to services and whether improvements are shared across communities.

Weak investment, skills gaps and unreliable or expensive infrastructure can constrain firms’ output and survival. Closures then affect workers, suppliers and local demand. Lower earnings and weak growth reduce household spending power and the tax base. Government faces pressure to fund support, maintain services and service debt. Poor health, housing insecurity and inadequate training can feed back into participation and productivity. These are plausible mechanisms; their size and the cause of each event require separate evidence.

GDP, output per hour and a national median income answer different questions. A rise in median real income before housing does not establish that families at the lower end can afford essentials. Use income after housing, material hardship, employment and underemployment, debt servicing and access to services alongside the national indicators. A business closure can reduce local opportunity even when a company’s remaining operations become more efficient. Track replacement employment and earnings, not just the initial announcement.

Framework: OECD Economic Survey 2026. The map is Social Herds’ analytical synthesis, not an OECD causal model.

Ministry for Regulation

The Ministry has delivered regulatory changes, but its economic return has yet to be demonstrated through measured outcomes. Its projected benefits give a case for the work, rather than proof that those gains have reached businesses and households. Success should be judged by realised reductions in unnecessary costs and delays, with public protections maintained. Claims of value for money remain provisional until those results are measured against the full costs.

Cost or commitment
Its 2025/26 annual-report summary records $18.295m operational expenditure and $0.555m capital expenditure. These cover one financial year, not its lifetime cost. Annual-report summary.

Results and limits of the evidence
Its newer value assessment projects $236m–$637m net public benefits over ten years across 20 reviews. For 12 reviews with changes already put into effect, it projects $34.62m–$94.04m over ten years. These remain estimates, including private compliance/time benefits; they are not cash already returned to the Crown. Motu undertook external conceptual review of the analyses. Latest assessment.

What should voters ask?
Track realised compliance savings, service quality and harms, who benefits, and costs across all affected agencies. Do not compare one year’s expenditure directly with ten years’ estimated benefits. The evidence supports scrutiny of benefits yet to be demonstrated, rather than a finding of no useful work.

Health NZ reforms and subsequent resets

Health restructuring has not yet delivered consistent access to planned care across New Zealand. The independent review found continuing geographic inequities and gaps in information about unmet need. Repeated organisational changes cannot be counted as improvements in care. The evidence supports a finding that an important reform objective remains unmet; it does not establish how much restructuring itself caused the problems. A complete account of transition costs and realised savings is still missing from this review.

Cost or commitment
Budget 2021 allocated $486m over four years to implement health reforms. This is an announced allocation, not a reconciled actual cost of every subsequent restructure. Original announcement.

Results and limits of the evidence
The 2025 Auditor-General review found continuing geographic inequities in planned-care access and gaps in information on unmet need. That shows important problems remained; it does not isolate the effect of restructuring from staffing, funding or demand. Independent review. Headline records also identify restructuring stopped in three areas and later devolution and hospital-restructure changes.

What should voters ask?
Publish a reconciled ledger of transition, redundancy, IT and consultancy costs and net recurring savings. Test treatment access, unmet need, workforce retention and equity. A total health deficit is not a measure of restructuring cost. No whole-reform, realised cost-benefit total was established in this review.

iReX ferry programme

The original iReX programme represents a substantial failure to turn public spending into the promised replacement ferries. The $671 million total covers earlier project work and wind-down as well as shipyard payments. Accountability must cover both the original cost escalation and the decision to cancel and replace the programme. Whether cancellation was the better choice depends on the alternatives available at the time, including future costs, delay and service risks.

Cost or commitment
KiwiRail reported a final entire-project cost of $671m: $449m in landside infrastructure, project management and wind-down, plus $222m paid to the shipyard. The final settlement was $144m within that $222m. KiwiRail, 15 August 2025.

Results and limits of the evidence
The original programme did not deliver its new ferries. The total includes spending before cancellation and possible reusable work or assets, so it is not all a cancellation penalty. KiwiRail’s stated replacement delivery target in that release was 2029; this review has not re-audited the replacement programme.

What should voters ask?
Compare the future costs and benefits of continuation versus replacement at the decision date, then include transition risks, delay and useful work retained. Sunk spending matters for accountability but is not, by itself, a reason to continue.

Callaghan Innovation

The disestablishment created a documented risk that recent investment would lose value, while benefits from the new arrangements still need to be demonstrated. The software expenditure illustrates the cost of changing direction before planned returns have been realised. The evidence reviewed does not establish a final write-off. Key functions are transferring, so the proper test is whether the new system retains useful capability and improves support for innovation after allowing for transition costs.

Cost or commitment
RNZ reported on 28 February 2025 that the agency said its new Workday system had cost $10.397m and its future was undecided. This was a dated risk of stranded investment, not proof of a final $10.397m write-off. RNZ report.

Results and limits of the evidence
MBIE confirms disestablishment with key functions redistributed. It is inaccurate to treat the agency’s disappearance as the disappearance of all innovation support. MBIE. A November 2025 headline reports $10.7m redundancies; that figure remains a lead pending direct financial verification.

What should voters ask?
What capability, contracts and systems were retained or reused? What was written off? Compare total transition costs with recurring savings, research capability, firm support and commercialisation outcomes.

Te Pūkenga, water reform and Auckland light rail

These cases expose the financial and delivery risks of major programmes followed by a change of direction. Light rail absorbed substantial spending without delivering the intended rail connection. For Te Pūkenga and water reform, the evidence reviewed identifies transition costs and disruption but does not establish a complete net cost or benefit. Reversal can be justified, but it needs a credible comparison showing how the replacement will solve the original problem more effectively.

Cost or commitment
The data identifies merger/de-merger costs, continuing IT procurement, consultancy work and an unused Three Waters office lease. These headline figures have not been reconciled to audited actual costs here. For light rail, the incoming government stated in January 2024 that over $228m had been spent. Cancellation announcement.

Results and limits of the evidence
These provide concrete cases of changing direction. They do not establish that every reversal was wrong or that all earlier spending was lost. The data also contains reported Te Pūkenga savings and a reported positive light-rail benefit-cost ratio, which need consideration alongside criticism.

What should voters ask?
Compare the original problem, predecessor performance, transition expense, reusable assets, ongoing costs and delivered outcomes. A change of agency or policy name does not demonstrate improvement.

Business closures: jobs, energy and regional economies

The closures show that national growth measures can conceal serious losses of local employment and productive capability. Energy costs and supply affected some industrial cases; falling livestock throughput and surplus processing capacity affected Smithfield. These require different responses. The evidence does not support attributing every closure to a single policy. Success means addressing the relevant constraints and helping affected communities regain lasting employment and earnings.

Winstone Karioi pulp and Tangiwai sawmill; Oji Penrose paper recycling mill, 2024

The Electricity Authority confirms both businesses cited high energy costs. It identifies gas scarcity and low hydro storage behind the winter price spike, and also found hedging offers were available. Authority review. These are historical closures; this review has not established the current status of each site.

Economic connection: Power affordability and risk management can affect industrial viability, jobs and suppliers. The findings do not allocate the cause entirely to one government decision.

Kinleith paper division, 2025

Oji announced closure of the PM6 paper machine, with around 230 jobs expected to go, while continuing pulp operations. It cited loss-making paper production, energy exposure and fibre costs. Company statement, 14 February 2025.

Economic connection: This was a production-line closure, not closure of the entire mill. Assess loss of domestic manufacturing and regional jobs alongside the viability of remaining operations and the move to imported paper.

Alliance Smithfield, 2024

Alliance described around 600 staff at peak season, with the vast majority expected to be made redundant and redeployment offered where possible. It cited declining sheep throughput, land-use change and surplus plant capacity. Company statement.

Economic connection: Land use, livestock supply and processing capacity connect. The closure need not mean all production disappears from NZ, but workers and the local economy can suffer substantial disruption. Peak staffing is not an audited count of permanent job losses.

Methanex, September 2026 headlines

The dataset records a planned 2027 shutdown or idling associated with declining gas supply and sale of gas entitlements. Reuters, 2 September 2026 corroborates the gas-sale and idling plan. A complete company filing and final employment outcome were not verified here.

Economic connection: Describe it as announced future idling, not a completed permanent closure. Assess security of energy supply, the alternative value of the gas and the loss of manufacturing activity together.

Headline evidence and sources

This selected review uses 30 records from Social Herds’ headline dataset, covering business closures, restructuring and policy changes. It is a case review, not a count of all business failures. Multiple stories may concern the same event. Headlines identify reported concerns and claims; linked official sources and company statements provide additional checks.

2024-08-21 · BusinessDesk
Winstone Pulp proposes closing mills with loss of 230 jobs
Source sheet row 33095 RowID 44589

2024-10-03 · RNZ
‘End of an era’ – Winstone Pulp International closes after 45 years
Source sheet row 37452 RowID 48979

2024-09-19 · Newsroom
75 jobs lost as high energy and labour costs close Penrose mill
Source sheet row 35973 RowID 47438

2025-02-17 · BusinessDesk
Kinleith paper operations to close, loss of 230 jobs
Source sheet row 46753 RowID 81799

2025-02-17 · RNZ
More than 200 jobs to be axed as Kinleith Mill closes paper division
Source sheet row 46848 RowID 81798

2024-09-30 · Interest
Big issues face Alliance as it plans closure of Smithfield plant
Source sheet row 36940 RowID 48401

2024-10-22 · RNZ
Smithfield meatworks closure: Fears impact could hit hard for years
Source sheet row 39268 RowID 50802

2024-10-30 · RNZ
Smithfield meatworks closure already impacting local economy
Source sheet row 39936 RowID 51438

2025-02-19 · RNZ
Callaghan Innovation shutdown: ‘Trying to build a plane as we’re falling off a cliff’
Source sheet row 47152 RowID 82076

2025-02-28 · RNZ
Callaghan Innovation’s new $10m software in limbo after shutdown news
Source sheet row 48197 RowID 83024

2025-11-08 · NZME
Taxpayers fork out $10.7m in redundancy costs for Government agency Callaghan Innovation
Source sheet row 62761 RowID 66345

2024-12-23 · RNZ
Government confirms plan to dismantle Te Pūkenga, re-establish polytechs
Source sheet row 44746 RowID 56254

2024-06-23 · RNZ
Multi-million-dollar IT project continues for Te Pūkenga despite looming demise
Source sheet row 28220 RowID 38821

2024-07-12 · RNZ
Te Pūkenga ordered to hire consultants to lead major cost-cutting exercise
Source sheet row 30177 RowID 40779

2024-08-07 · RNZ
Te Pūkenga makes $50m in cost savings, still faces $37m deficit at end of 2023
Source sheet row 31685 RowID 43134

2025-04-01 · RNZ
Health New Zealand stops restructuring in three areas
Source sheet row 48504 RowID 57155

2025-12-03 · RNZ
Health NZ devolving decision-making receives positive feedback – Health Minister
Source sheet row 64779 RowID 68504

2026-03-20 · Post
This devolution plan won’t solve the problems besetting Health NZ
Source sheet row 70140 RowID 4026

2026-07-02 · RNZ
Health NZ shelves major hospital restructure
Source sheet row 76296 RowID 76626

2025-05-22 · Herald
Government’s Regulatory Standards Bill to cost $20m per year
Source sheet row 49745 RowID 71436

2025-07-17 · RNZ
Ministry feared costs of $60m a year to review laws under Regulatory Standards Bill
Source sheet row 54056 RowID 75527

2025-07-21 · RNZ
Regulations ministry clarifies cost estimate for Regulatory Standards Bill
Source sheet row 54313 RowID 57763

2026-05-20 · BusinessDesk
Seymour’s red tape ministry now four times bigger than agency it replaced
Source sheet row 73524 RowID 8918

2026-06-18 · Newsroom
Seymour sells his red tape ministry – but who reaps the rewards?
Source sheet row 75328 RowID 70023

2026-07-31 · Herald
New Ministry of Regulation report recommends legalising plug-in solar
Source sheet row 78665 RowID 78594

2026-07-31 · RNZ
Ministry for Regulation recommends legalising plug-in solar
Source sheet row 78730 RowID 78593

2024-01-15 · RNZ
National-led government officially cancels Auckland Light Rail plans
Source sheet row 13886 RowID 24460

2024-02-05 · BusinessDesk
Auckland light rail had positive benefit-cost ratio, investor interest
Source sheet row 15304 RowID 25933

2025-07-08 · Herald
Lease termination for unused Three Waters Auckland office costs taxpayers $2.2m
Source sheet row 53244 RowID 74843

2026-09-03 · 1News
Methanex to close Taranaki plant, citing ‘decline’ in gas supply
Source sheet row 82151 RowID 83734

How to read the costs and benefits

A full audit would require actual rather than allocated Health NZ transition costs, recurring savings net of replacement staffing and contracts, the final fate of Callaghan’s software and assets, reconciled Te Pūkenga and water-reform transition ledgers, and follow-up employment and production data for affected communities. No monetary estimate of the national cost of policy churn or lost productivity is made here. Do not sum repeated news stories into jobs lost, or compare annual operating expenditure with multi-year benefits as if they were equivalent.

Costs shown use different periods and accounting bases. An operating expense, a capital asset, a funding allocation, a forecast benefit and a cancellation settlement should not be added into a single “waste” figure. Dates and wording in the headline evidence are preserved from the dataset; a dataset date may be a collection date rather than the date of the event.

Evidence reviewed 22 October 2026. The source workbook covers 1 June 2023–11 October 2026. Official sources are linked beside the relevant findings.

Where are we now?

Assessment at 21 October 2026: the evidence points to a modest, uneven recovery. Output has continued growing, but unemployment and inflation remain concerns. The longer-term test is whether investment and productivity can deliver sustained improvements in living standards.

IndicatorPublished resultWhat it tells voters
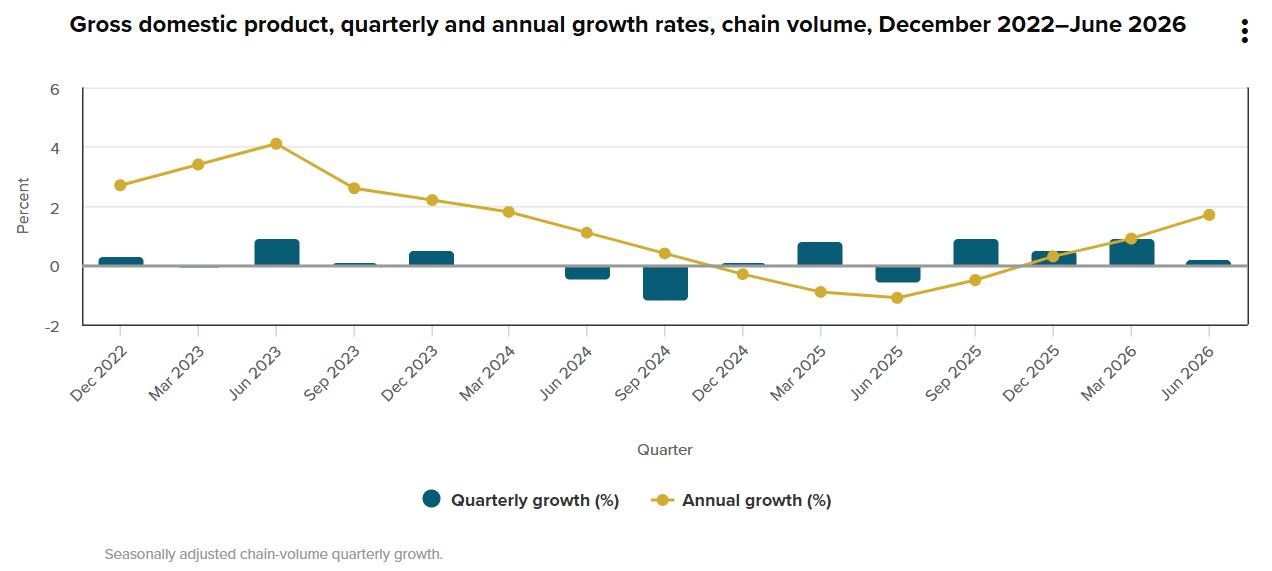
Economic growthReal GDP rose 0.2% in the June 2026 quarter, after 0.9% in March.Output grew, but more slowly. To judge living standards, also examine output per person and real household incomes.
Employment opportunitiesUnemployment was 5.6% in June 2026, up from 5.4% in March.Recovery had not yet reduced the unemployment rate. Job availability, hours and earnings matter alongside GDP.
InflationConsumer prices rose 4.1% in the year to June 2026.Inflation was above the Reserve Bank’s 1–3% target range. Slower future inflation would not reverse accumulated price rises.
Government financesAt June 2026, net core Crown debt was 40.9% of GDP, down from 41.8% a year earlier. The OBEGALx operating deficit was $8.7 billion.The debt ratio improved, although debt increased in dollars. Assess spending, revenue, assets and investment together; a lower debt ratio alone does not establish better services or infrastructure.

These measures cover different aspects of performance and are not added together. GDP changes are quarterly and adjusted for inflation and seasonality; unemployment is seasonally adjusted; CPI is an annual change; fiscal results cover the year ended June. September-quarter CPI is scheduled for 22 October 2026, after this assessment date.

Sources: Stats NZ: GDP · Stats NZ: labour market · Stats NZ: CPI · Treasury: audited 2025/26 financial statements.

Economic growth weakened during 2024 before recovering unevenly. GDP grew 0.2% in the June 2026 quarter. Bars show quarterly growth; the line compares output over each year with the preceding year.

Source: Stats NZ, June 2026 quarter.

The OECD forecast (3 June 2026): a gradual but fragile recovery for New Zealand.

Real GDP growth forecast20262027
Annual growth1.4%2.2%

The OECD expected earlier interest-rate reductions and resilient exports to support growth, while higher energy costs and uncertainty would restrain household spending and investment. It warned that further energy disruption or adverse climate events could weaken the recovery. OECD

Its longer-term message was that stronger productivity, more reliable and affordable energy, better access to investment finance, and innovation are needed to improve performance. OECD

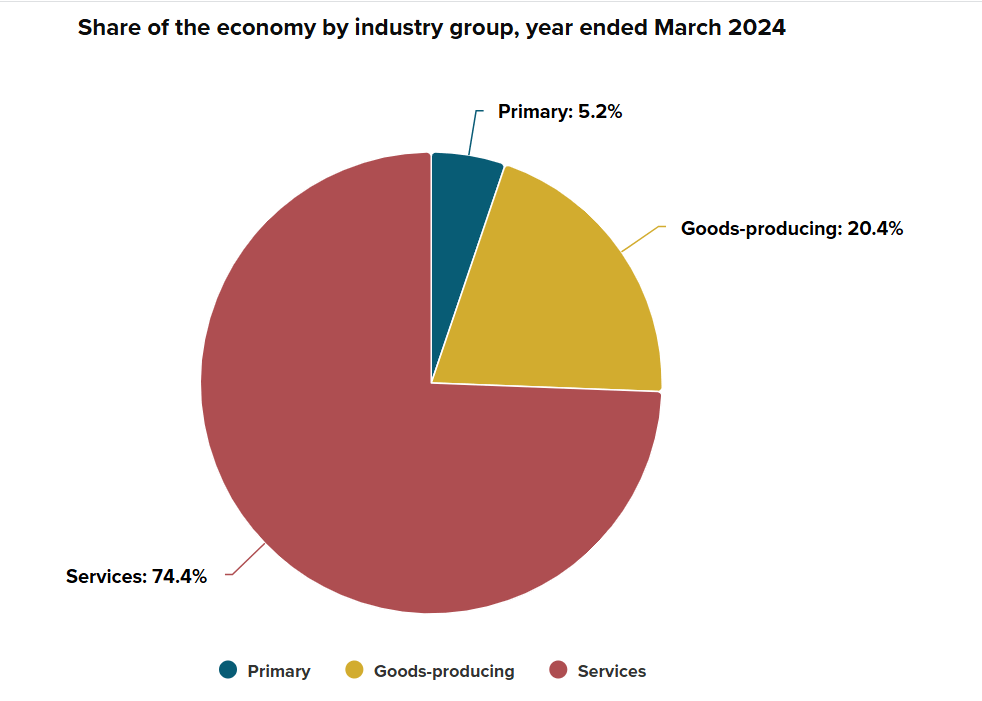
What makes up the New Zealand Economy

Industry groupShare of industry outputIncludes
Services74.4%Retail, transport, finance, professional services, health, education and other services
Goods-producing20.4%Manufacturing, construction, electricity, gas, water and waste services
Primary5.2%Agriculture, forestry, fishing and mining

Recovery and lasting prosperity are different challenges

A recovery brings unused capacity back into production and can help people find work. Lasting prosperity requires the economy to produce more value with its people, capital and resources. That depends on investment, skills, innovation, effective institutions and infrastructure that works.

The OECD’s 2026 assessment identifies weak productivity and investment as persistent concerns. Its recommendations include improving access to finance so businesses can grow. These longer-term constraints help explain why a return to quarterly growth is only the beginning of the economic task.

Evidence: OECD: New Zealand economic snapshot · OECD Economic Survey 2026: executive summary.

What needs to improve?

Productivity and better jobs

Help firms and workers produce more value per hour. Assess real wages, output per hour, skills and access to secure work—not simply the total size of the economy.

Investment and innovation

Connect finance, research, technology and skills with businesses able to use them. Judge policies by additional productive activity and results, alongside their cost.

Infrastructure and resilience

Maintain essential networks and plan for disruption. Assess dependable services, avoided damage and whole-of-life costs, as well as new construction.

Government finances, trade and the distribution of gains connect these priorities. Policy needs to explain what is funded, who benefits, what risks are taken and whether improvements can endure through changes of government.

What should voters ask of economic policies?

  • What problem changes? Explain how the proposal improves investment, productivity, employment, resilience or public services.
  • What is the evidence? Distinguish measured results from forecasts and promised gains.
  • Who pays and who benefits? Include ongoing costs and the effects on different households, businesses and regions.
  • What happens over time? Set a timetable and account for skills, infrastructure and delivery capacity.
  • How will we know? Publish a starting point, measurable outcomes and independent evaluation.

OBEGALx means the operating balance before gains and losses, excluding ACC. It differs from the overall operating balance, which includes other items. Net core Crown debt is one specific debt measure; comparisons with older figures require consistent definitions.

How do the seven parties’ policies relate to the wider economy?

This comparison focuses on government finances, the tax base, employment, trade and economic resilience. Grocery, power, fuel and insurance reforms are covered on Cost of Living; detailed research, technology, skills and business-innovation proposals are covered on Productivity and Innovation.

These are selected published proposals checked on 21 October 2026, not a complete inventory or a ranking. Tax, employment and investment overlap: the focus here is their economy-wide and fiscal role. Potential benefits and limitations are Social Herds’ assessment, not independently verified predictions. Missing detail in this selection does not establish that a party has no policy.

National
Published policyIssue it addressesReview: potential benefits and limitations
Fiscal restraint and no new taxes. Proposes a surplus in 2028/29, expenditure moving towards 30% of GDP, and debt below 40% of GDP over time. Fiscal planPersistent operating deficits, debt servicing and capacity to respond to shocks.Potential benefit: A published spending and debt framework makes the intended direction explicit and could rebuild fiscal room.

Limitations and questions: Restraint must be tested against service demand, inflation and infrastructure maintenance. Spending reductions can shift costs or defer necessary work; assess the actual savings and the definition of debt, not just the target.

Trade diversification and supply agreements. Proposes new trade negotiations, essential-supply agreements, streamlined trade processes and a goal of doubling export value by 2034. Trade policyDependence on overseas demand, market concentration and disruption of essential imports.Potential benefit: Broader market access and supply relationships could reduce concentration risks and open opportunities.

Limitations and questions: Agreements do not guarantee sales or delivery during a crisis. Measure additional exports, market diversification and usable supply commitments. Export values can rise because of prices rather than volumes.

Labour
Published policyIssue it addressesReview: potential benefits and limitations
Fiscal plan. Proposes an OBEGAL surplus in 2028/29, a $2.4 billion operating allowance per Budget, and net debt below 20% of GDP over time. The party commissioned Hall Chadwick to review the plan, conditional on its assumptions. Fiscal planFunding services and investment while closing the operating deficit.Potential benefit: Provides an explicit fiscal framework and an external costing review. Recognising assets alongside liabilities can support consideration of long-lived investment.

Limitations and questions: A costing review does not guarantee growth, revenue or delivery. The debt and surplus measures differ from those used in other plans; compare on common definitions. “Over time” needs a clear trajectory.

Targeted capital gains tax. Proposes a 28% tax on qualifying gains on residential investment and commercial property from 1 July 2027; the family home and specified other assets are exempt. Revenue is earmarked for health. Tax policyThe revenue base and differences in tax treatment between income sources and assets.Potential benefit: Broadens taxation of qualifying property gains and identifies a use for the revenue.

Limitations and questions: Revenue depends on gains and sales, so timing and volatility matter. Exemptions, valuations and behavioural responses affect fairness, complexity and yield. Assess the revenue design here; detailed healthcare benefits belong on the Health page.

Greens
Published policyIssue it addressesReview: potential benefits and limitations
Tax-base reform. Proposes a 2.5% wealth tax above $10 million in net assets, with a family-home exemption, a tax on qualifying large gifts and asset transfers, and higher company tax for the largest corporations. Tax policyRevenue for public services and the distribution of the tax burden between earnings, wealth and businesses.Potential benefit: Could broaden revenue sources and shift more of the burden towards substantial wealth and large companies.

Limitations and questions: How much revenue would these taxes actually raise? Assets such as businesses can be difficult to value, and some owners may have substantial wealth but little cash to pay an annual tax. People and companies may also change where or how they hold their assets. Revenue estimates need to account for these responses, exemptions and collection costs. The published figures are the Greens’ forecasts, rather than guaranteed revenue.

Youth Jobs Guarantee. Proposes a pathway into education, training or a new job for 16–24-year-olds out of work for six months, including additional local jobs and expanded council-linked support. Employment policyYouth unemployment and the risk of prolonged disconnection from work.Potential benefit: Could provide paid experience and useful community work; the policy explicitly says jobs must not replace existing workers.

Limitations and questions: Needs viable placements, supervision and employer participation. Track sustained employment and earnings after support ends, additionality and the cost per lasting outcome. Training-system design is assessed on the Productivity and Innovation page.

ACT
Published policyIssue it addressesReview: potential benefits and limitations
Spending reductions and a smaller government. Proposes reducing spending outside welfare and protected frontline services by $9.5 billion annually when fully implemented, with 19 departments and 18 ministers. Fiscal planDeficits, administrative costs and government accountability.Potential benefit: Identifies a fiscal savings target and proposes clearer ministerial responsibility.

Limitations and questions: The savings and lower-debt figures are party projections. Distinguish genuinely unnecessary spending from capability supporting frontline services. Agency mergers have transition costs; test service outcomes and effects on employment and demand.

Raise NZ Super eligibility gradually to 67 by 2035, with compassionate early access for people with substantial careers in physically demanding work. Retirement proposal within fiscal planAgeing-related spending pressures and the distribution of retirement costs across generations.Potential benefit: Could reduce future pension spending and increase participation among people able to work longer.

Limitations and questions: People differ in health, occupation and employment prospects. Early-access rules, bridging support and administration determine who bears the burden. Net savings should allow for other benefit and health costs.

New Zealand First
Published policyIssue it addressesReview: potential benefits and limitations
SME company tax. Proposes reducing company tax from 28% to 20% for companies with turnover below $30 million. Its announcement estimates an initial annual fiscal cost of about $1 billion. Company-tax proposalThe distribution of business taxation and cash available to eligible firms.Potential benefit: Could leave eligible companies with more after-tax cash and reduce financing pressure.

Limitations and questions: The claim that growth will cover the cost is a party expectation, not an established result. Examine threshold incentives, company restructuring, treatment of shareholder dividends, and whether gains reach employment or investment rather than only distributions. Explain how the initial revenue gap is funded.

Opportunities Party (TOP)
Published policyIssue it addressesReview: potential benefits and limitations
Tax Reset. Proposes land-value taxation alongside a Citizen’s Income, changes to income-tax and benefit arrangements, and compulsory retirement saving, phased in over time. Tax ResetLong-term revenue sustainability, the tax mix and the relationship between tax, welfare and retirement funding.Potential benefit: Offers a linked redesign rather than isolated changes, with a land-based revenue source and a simpler proposed income floor.

Limitations and questions: Treat funding and administrative-savings claims as party estimates. Test land valuations, deferrals, cash-flow pressures, benefit top-ups and transition costs together. The package’s household effects belong on other pages; here the test is fiscal robustness under different economic conditions.

Te Pāti Māori
Published policyIssue it addressesReview: potential benefits and limitations
Tax and public-service funding. Its published tax summary proposes a greater contribution from the wealthiest to fund housing, health, education and whānau support. Published tax summaryDistribution of the tax burden and resources available for public services.Potential benefit: Makes revenue distribution and service funding explicit priorities.

Limitations and questions: The accessible summary establishes a direction, not enough detail to assess tax rates, thresholds, revenue, fiscal balance or implementation. Its linked full policy document could not be inspected in this review. This is a limit of this comparison, not evidence that the party has no detailed policy.

Compare fiscal promises on the same basis

A 20% debt target and a 40% debt target may use different definitions of debt. Likewise, OBEGAL and OBEGALx differ in their treatment of ACC. A shared surplus year does not mean identical fiscal settings. Before comparing parties, align the measure, forecast years, economic assumptions and treatment of assets and capital spending.

For every plan, ask: what is funded, what changes if growth or tax revenue disappoints, what happens to service quality, and who carries the risks? A smaller deficit, a new tax or an employment target is one part of the assessment; delivery and lasting living standards matter too.

Sources are linked beside each proposal. This is a review of selected published material, not a complete audit of manifestos, independent modelling of their costings or a prediction of coalition agreements.

New Zealand’s Economy data Pre 2020

OECD Outlook 2019

OECD interim Economic Outlook March 2019

New Zealand’s level of debt is below the OECD average.  The OECD website enables comparisons on a number of dimensions across a range of OECD countries.  The website enables NZ to be compared with a range of other OECS countries.

Government Debt as a percentage of GDP

http://www.tradingeconomics.com/new-zealand/government-budget

Government Debt

Generally, Government debt as a percent of GDP is used by investors to measure a country ability to make future payments on its debt, thus affecting the country borrowing costs and government bond yields (NZ Treasury).

New Zealand recorded a government debt equivalent to 19.90 percent of the country’s Gross Domestic Product in 2018. Government Debt to GDP in New Zealand averaged 23.70 percent from 1972 until 2018, reaching an all time high of 54.80 percent in 1992 and a record low of 4.40 percent in 1974.

Government Debt as a percentage of GDP

http://www.tradingeconomics.com/new-zealand/government-budget

Economic Resilience

The 2008 report – Measuring New Zealand’s Progress Using a Sustainable Development Approach (NZ Statistics) identifies 6 measures of economic resilience:
Real net stock of total assets per person (data available for 2013)
Real net stock of infrastructure per person
Real investment in fix captial per person
Ratio of debt services to export earnings
Diversity of exports
Government debt

The 2008 report is the most recent with exception of #1.  This is problematic as the Global Financial Crisis 2008 had a significant impact on NZ economy and level of debt

The NZ economic chart pack has many economic indices – unfortunately the measures don’t align with  the economic resilience indicators used by the Statistic New Zealand’s Progress indicator.

Download the PDF document here

Productivity and innovation

“Generally speaking, the higher the productivity of a country, the higher the living standards that it can afford and the more options it has to choose from to improve well-being. High productivity societies are characterised by:

smart choices about savings and investment versus current consumption;
dynamic and competitive markets;
openness to trade and to international connectedness;
high awareness of external influences;
rapid uptake and smart application of new technologies, products and processes; and
increasing demand for highly skilled and creative people.

These are the successful societies that attract and retain people, ideas and capital”.

Reform Agenda – Conway (2016, 2018)
flexibility, openness and receptiveness to new technology.
prioritising trade in services and digital products in New Zealand’s trade strategy;
improving the matching of skills to jobs, including encouraging the education system to be more adaptive and responsive to labour market demands;
focusing immigration policy on lifting the skill composition of the workforce;
making investment easier and more effective, including different forms of taxation and saving (e.g.,business assets and housing);
enhancing New Zealand’s policymaking capability (including the use of monitoring and evaluation) and the delivery of services

Assets and Infrastructure

Definition – Assets and infrastructure

Net (wealth) capital stock refers to the current market valuation of an industry’s or an economy’s productive stock (OECD).
This includes fixed assets, such as machinery, equipment, buildings, and infrastructure that can be used in production for more than one year.
The real net stock of total assets represents accumulated investment, less retirements and accumulated depreciation for assets still operating (that is, gross capital stock less accumulated depreciation on assets still in operation). Ensuring that a broad base of assets is maintained can increase opportunities for future economic development.
This indicator is expressed in 1995/96 dollars, to remove the effect of price changes. (NZ Statistics)

New Zealand Economy

New Zealand’s economy:

  • the 53rd-largest national economy in the world when measured by nominal gross domestic product (GDP)
  • 68th-largest in the world when measured by purchasing power parity (PPP).
  • one of the most globalised economies depends on international trade – mainly with Australia, the European Union, the United States, China, South Korea, Japan and Canada
  • diverse with a sizable service sector, accounting for 63% of all GDP activity as of 2013.[15]
  • has large-scale manufacturing industries include aluminium production, food processing, metal fabrication, wood and paper products. Mining, manufacturing, electricity, gas, water, and waste services accounted for 16.5% of GDP as of 2013.[15]
  • the primary sector continues to dominate New Zealand’s exports, despite accounting for only 6.5% of GDP as of 2013.[15]